Massive Memory Leak in the Matlab Engine for Python
As of Matlab 2014b, Matlab includes a Python module for calling Matlab code from Python. This is how you use it:
import numpy
import matlab
import matlab.engine

eng = matlab.engine.start_matlab()
random_data = numpy.random.randn(100)
# convert Numpy data to Matlab:
matlab_data = matlab.double(random_data.tolist())
data_sum = eng.sum(matlab_data)
You can call any Matlab function on eng, and you can access any Matlab workspace variable in eng.workspace. As you can see, the Matlab Engine is not Numpy-aware, and you have to convert all your Numpy data to Matlab double before you can call Matlab functions with it. Still, it works pretty well.
Recently, I ran a rather large experiment set, where I had a set of four functions, two in Matlab, two in Python, and called each of these functions a few thousand times with a bunch of different data to see how they performed.
While doing that I noticed that my Python processes were growing larger and larger, until they consumed all my memory and a sizeable chunk of my swap as well. I couldn't find any reason for this. None of my Python code cached anything, and the sum total of all global variables did not amount to anything substantial.
Enter Pympler, a memory analyzer for Python. Pympler is an amazing library for introspecting your program's memory. Among its many features, it can list the biggest objects in your running program:
from pympler import muppy, summary
summary.print_(summary.summarize(muppy.get_objects()))
                                      types |   # objects |   total size
=========================================== | =========== | ============
                        <class 'array.array |        1076 |      2.77 GB
                                <class 'str |       42839 |      7.65 MB
                               <class 'dict |        8604 |      5.43 MB
                      <class 'numpy.ndarray |          48 |      3.16 MB
                               <class 'code |       14113 |      1.94 MB
                               <class 'type |        1557 |      1.62 MB
                               <class 'list |        3158 |      1.38 MB
                                <class 'set |        1265 |    529.72 KB
                              <class 'tuple |        5129 |    336.98 KB
                              <class 'bytes |        2413 |    219.48 KB
                            <class 'weakref |        2654 |    207.34 KB
            <class 'collections.OrderedDict |          65 |    149.85 KB
                 <class 'wrapper_descriptor |        1676 |    130.94 KB
  <class 'traitlets.traitlets.MetaHasTraits |         107 |    123.55 KB
                  <class 'getset_descriptor |        1738 |    122.20 KB
Now that is interesting. Apparently, I was lugging around close to three gigabytes worth of bare-Python array.array. And these are clearly not Numpy arrays, since those would show up as numpy.ndarray. But I couldn't find any of these objects in my workspace.
So let's get a reference to one of these objects, and see who they belong to. This can also be done with Pympler, but I prefer the way objgraph does it:
import array
# get a list of all objects known to Python:
all_objects = muppy.get_objects()
# sort out only `array.array` instances:
all_arrays = [obj for obj in all_objects if isinstance(obj, array.array)]

import objgraph
objgraph.show_backrefs(all_arrays[0], filename='array.png')
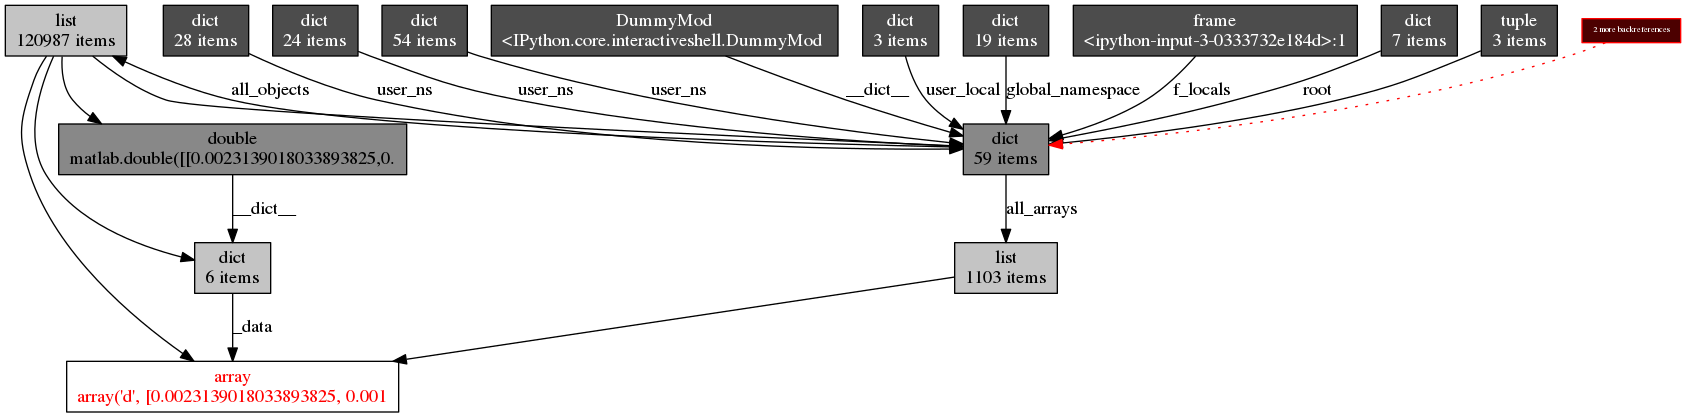
It seems that the array.array object is part of a matlab.double instance which is not referenced from anywhere but all_objects. A memory leak.
After a bit of experimentation, I found the culprit. To illustrate, here's an example: The function leak passes some data to Matlab, and calculates a float. Since the variables are not used outside of leak, and the function does not return anything, all variables within the function should get deallocated when leak returns.
def leak():
    test_data = numpy.zeros(1024*1024)
    matlab_data = matlab.double(test_data.tolist())
    eng.sum(matlab_data)
Pympler has another great feature that can track allocations. The SummaryTracker will track and display any allocations between calls to print_diff(). This is very useful to see how much memory was used during the call to leak:
from pympler import tracker
tr = tracker.SummaryTracker()
tr.print_diff()
leak()
tr.print_diff()
                     types |   # objects |   total size
========================== | =========== | ============
       <class 'array.array |           1 |      8.00 MB
...
And there you have it. Note that this leak is not the Numpy array test_data and it is not the matlab array matlab_data. Both of these are garbage collected correctly. But the Matlab Engine for Python will leak any data you pass to a Matlab function.
This data is not referenced from anywhere within Python, and is counted as leaked by objgraph. In other words, the C code inside the Matlab Engine for Python copies all passed data into it's internal memory, but never frees that memory. Not even if you quit the Matlab Engine, or del all Python references to it. Your only option is to restart Python.
Postscriptum
I since posted a bug report on Mathworks, and received a patch that fixes the problem. Additionally, Mathworks said that the problem only occurs on Linux.
