Analyzing Speech Signals in Time and Frequency
Our first stop in speech analysis is usually the short-time Fourier transform, or STFT1:
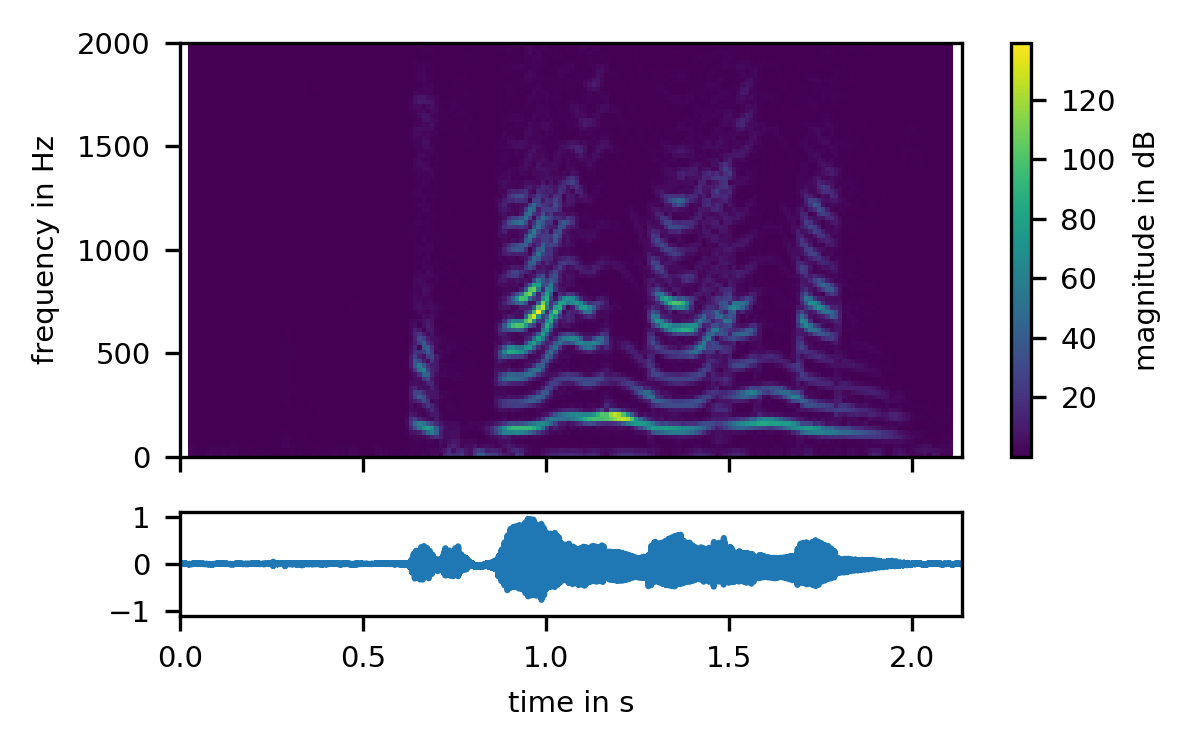
As we can see, this speech signal has a strong fundamental frequency track around 120 Hz, and harmonics at integer multiples of the fundamental frequency. We perceive the frequency of the fundamental as the speech's pitch. The magnitude of the harmonics varies over time, which we perceive as the sounds of different vowels.
All of this is clearly visible in this STFT. To calculate the STFT, we chop up the audio signal into short, overlapping blocks, apply a window function 2 to each of these blocks, and Fourier-transform each windowed block into the frequency domain:
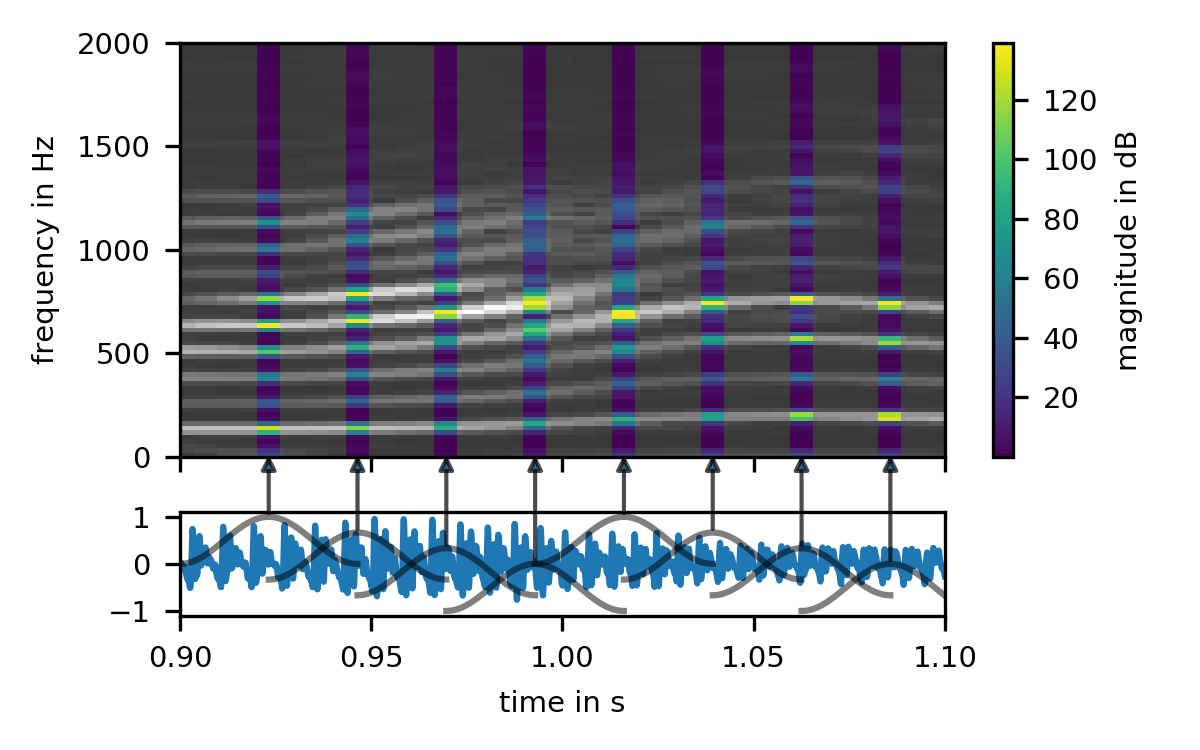
We zoomed in a bit to make this visible. At this zoom level, an old friend becomes visible in the waveform: The waveform of our harmonic spectra is clearly periodic. We also see that each of our blocks contain multiple periods of the speech signal. So what happens if we make our blocks shorter?
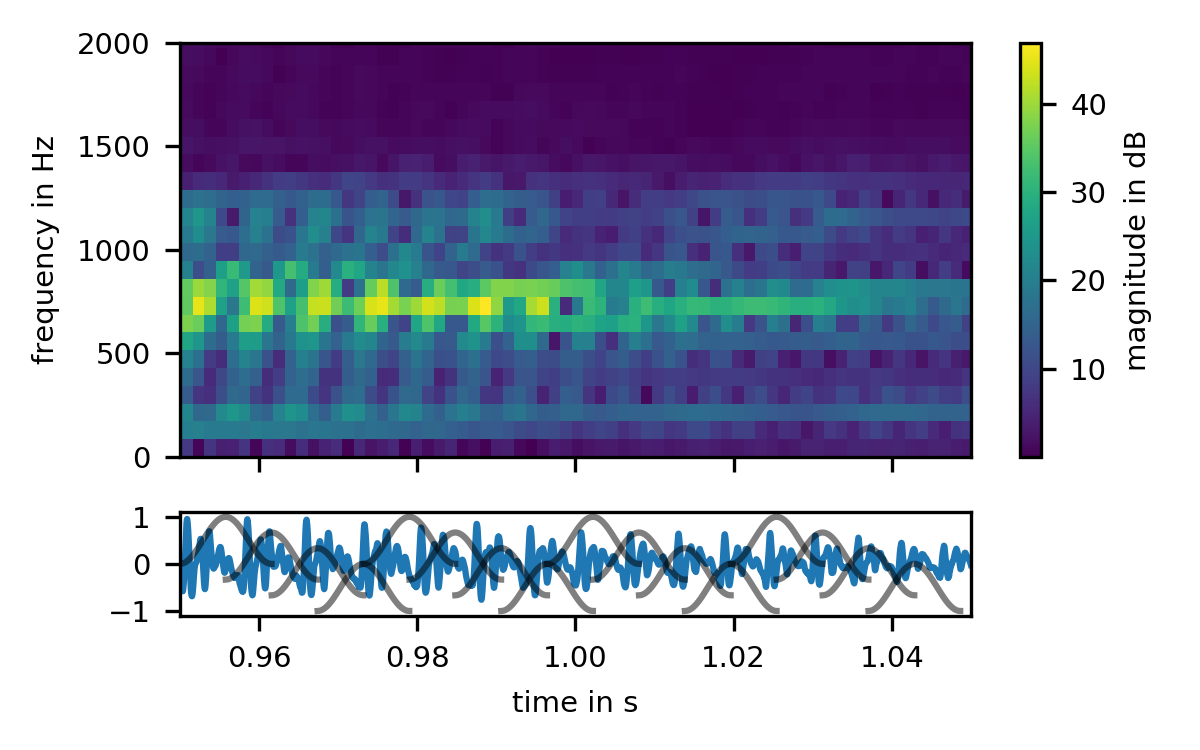
As we make our blocks shorter, such that they only contain a single period of the signal, a funny thing happens: the harmonic structure vanishes. Why? Because the harmonic structure is caused by the interference between neighboring clicks; As soon as each block is restricted to a single period, there is no interference any longer, and no harmonic structure.
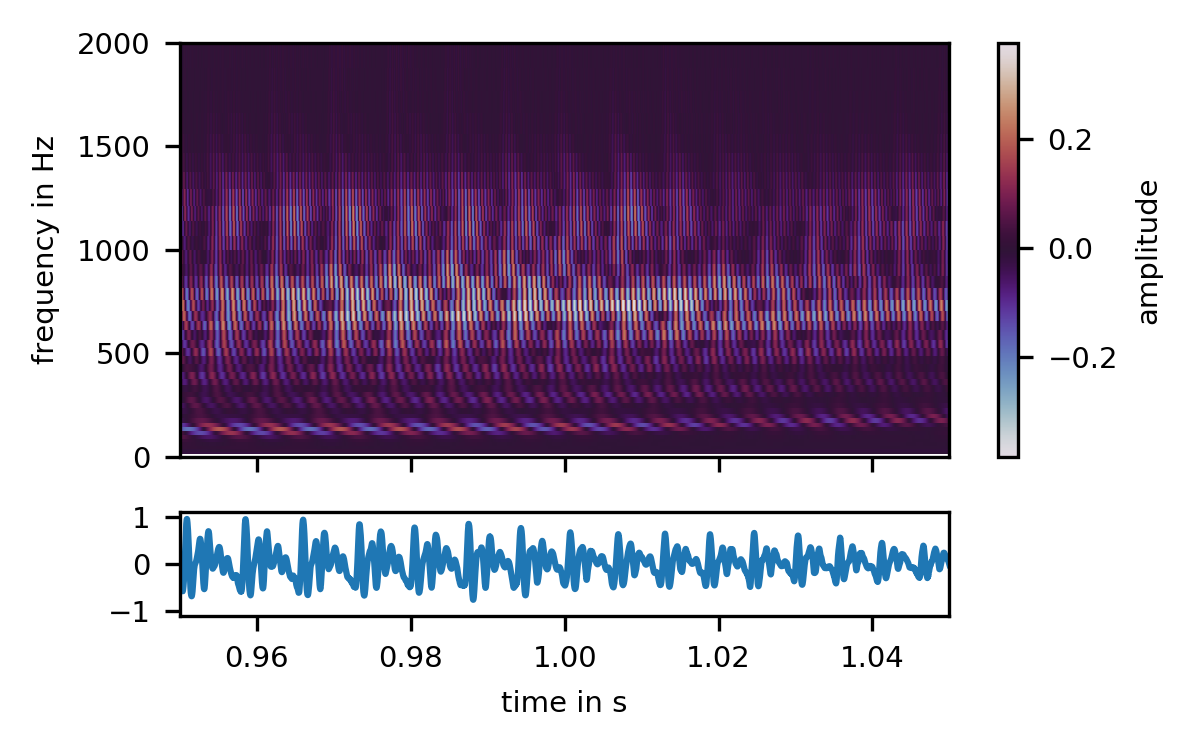
But instead of a harmonic structure, we see the periodicity of the waveform emerge in the STFT! To look at this phenomenon in a bit more detail, we will have to leave the classical STFT domain, and look at a close sibling, the Constant Q Transform, or CQT. The CQT is simply an STFT with different block sizes for different frequencies:
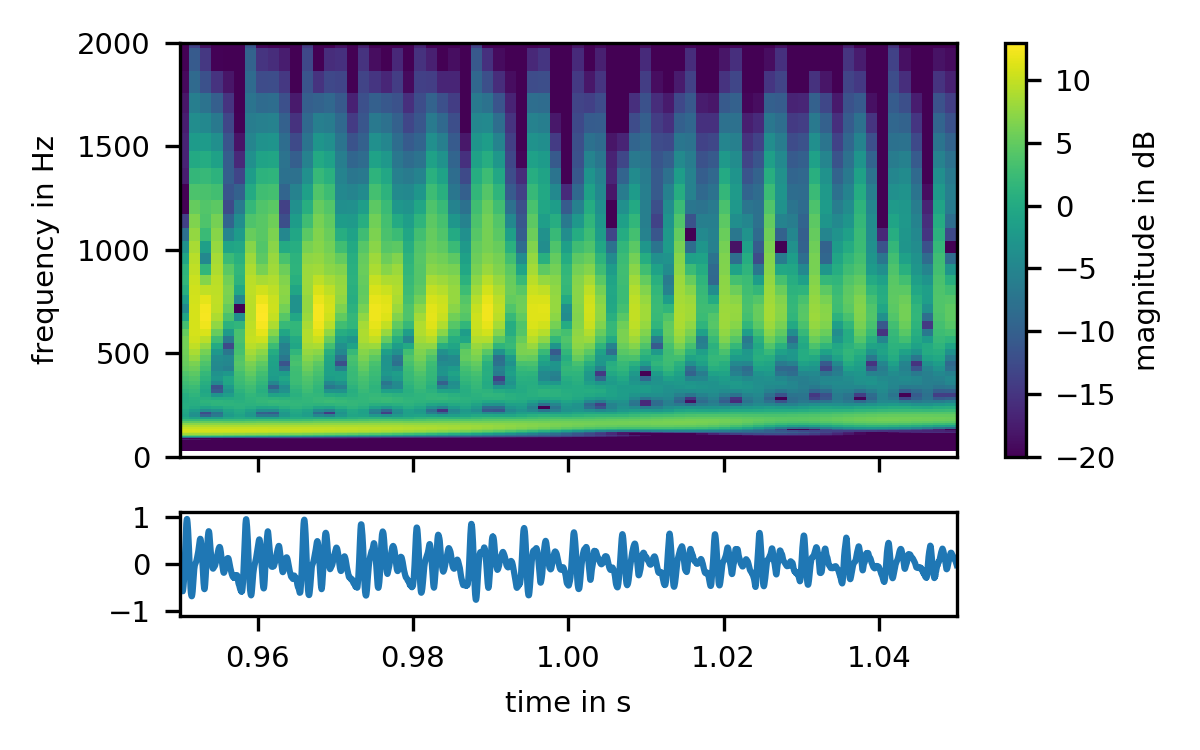
The periodic structure of the signal is now perfectly apparent. Each period of the signal gives rise to a skewed click-like spectrum that repeats at the fundamental frequency. Interestingly, however, the fundamental itself shows no periodicity. To see why this is so, and to finally get a grasp of how the short-time Fourier transforms interprets signals, we have to turn to our last graph, a gamma-tone filterbank:
The fundamental frequency is now clearly a visible as a single sinusoid, rotating its merry way at 120 Hz. Each harmonic is its own sinusoid at an integer multiple of the fundamental frequency, but changing in amplitude in lockstep with the findamental. Thus in this graph, we see both the harmonicity and the periodicity at the same time, and can finally appreciate the complex interplay of magnitudes and phases that give rise to the beautiful and simple sound of the human voice3.
