Posts tagged "signal-processing"
How we perceive Speech
Now that I am officially a failed scientist, I might as well talk about my research in public. I spent the last few years analyzing speech recordings. Particularly, voiced speech, where vibrations in the vocal folds excite resonances in the vocal tract, and a tonal sound leaves our mouths and noses.
As humans, we are particularly tuned to recognizing these kinds of sounds. Even in loud background noise, even with dozens of people talking at the same time, we can clearly identify the sound of a human voice (even if we might not be able to understand the words).

Looking at these sounds from a physical point of view, we can see that it is made up of a fundamental frequency at the voice's pitch, and harmonics at integer multiples of the fundamental. And even though the sound is clearly composed of multiple harmonics, we perceive it as a single sound with a single pitch. Even more perplexing, we attribute all of these harmonics to a single voice, even if they criss-cross with tonal sounds from different sources.
Yet, speech recognition systems regularly struggle with such tasks, unless we feed them unholy amounts of data and processing power. In other words, there has to be more to speech than the simple figure above indicates.
One area is definitely time resolution. Obviously, when the vocal folds open to admit a puff of air into the vocal tract, phases align, and loudness is higher than when the vocal folds have closed again and phases go out of sync. This happens several hundreds of times per second, at the frequency of the fundamental. Yet, this phase coherence is invisible in most of our visualizations, such as the spectrogram above, or the MFCCs usually used in speech recognition, as they are too coarse for such short-time detail.
An even more interesting detail emerges from fMRI scans of people who are speaking, and people who are listening to speech: their activation patterns are strikingly similar. As in, motor groups are activating when listening, just as if actual speech muscles were moved. To me, this indicates that when we listen to speech, we simulate speaking. And I find it highly likely that we understand speech mostly in terms of the movements we would have to make to imitate it. In other words, we do not internalize speech as an audio signal, but as muscle movements.
This matches another observation from a different area: When learning a foreign language, we can not hear what we can not produce. If you didn't learn how to speak an Ö and Ü (two German umlauts) as a child, you will have a hard time hearing the difference as an adult. Yet they sound completely distinct to me. In a production model, this makes a lot of sense, as we wouldn't know how to simulate a sound we can not produce.
Bringing this back to the science of signal processing, I believe that most speech analysis algorithms are currently lacking a production model of speech. Speech can not be fully understood as an audio signal. It needs to be understood in terms of the variables and limitations of a human vocal tract. I believe that if we integrated such a physiological production model into our machine learning models, we wouldn't need to feed them such vast amounts of data and electricity, and might even get by without them.
Periodicity and Harmonicity
A periodic signal has a harmonic spectrum. In the extreme case, a click train signal has a comb spectrum:
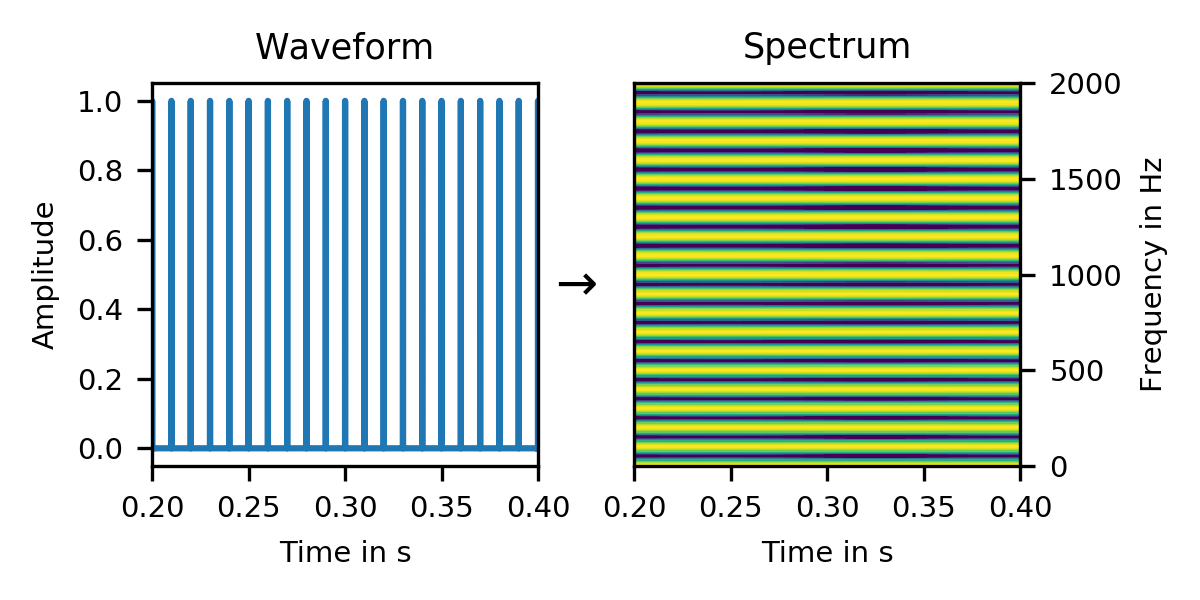
But why? After all, a solitary click has a uniform spectrum. So why should the sum of multiple clicks have a non-uniform spectrum?
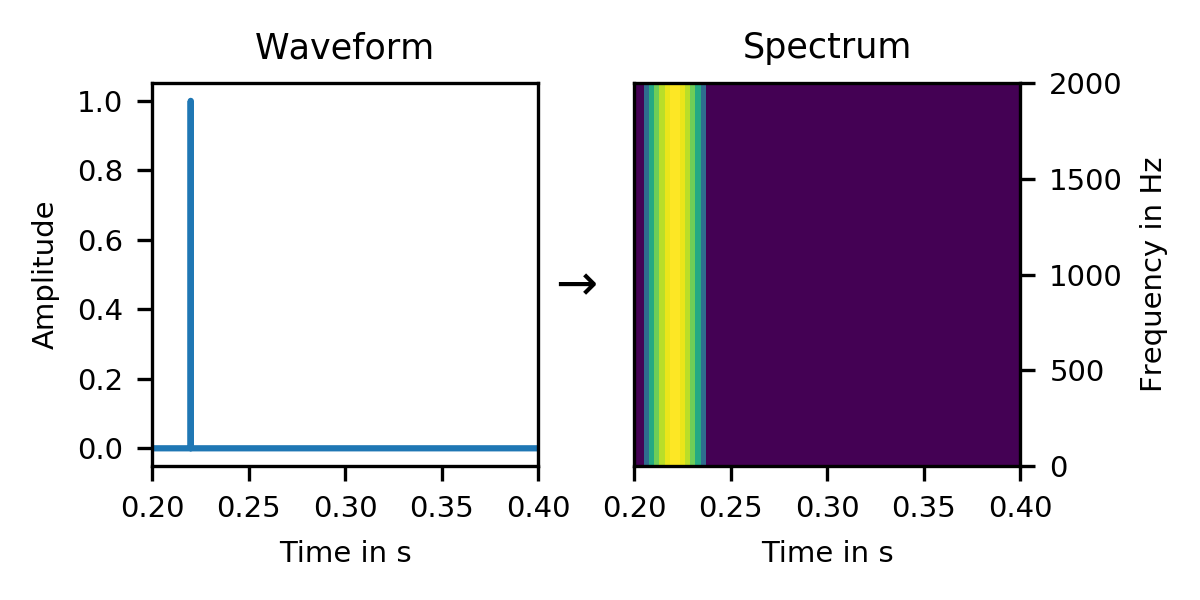
The answer exposes a lot of detail of how spectra work, and gives us a glimpse into the inner workings of spectral phases. Let's start with that click: In that spectrum, we see that we can decompose a click into a sum of sine waves:

As we have seen in the spectrum of the click earlier, it is composed of all frequencies (uniform spectrum). But we see here that the individual sine waves are delayed just so, that they all add constructively at exactly one time, and form the click. At all other times, they cancel each other out. This per-sine delay is called the phase of that frequency.
But what happens if we have more than one click? How does that change things?
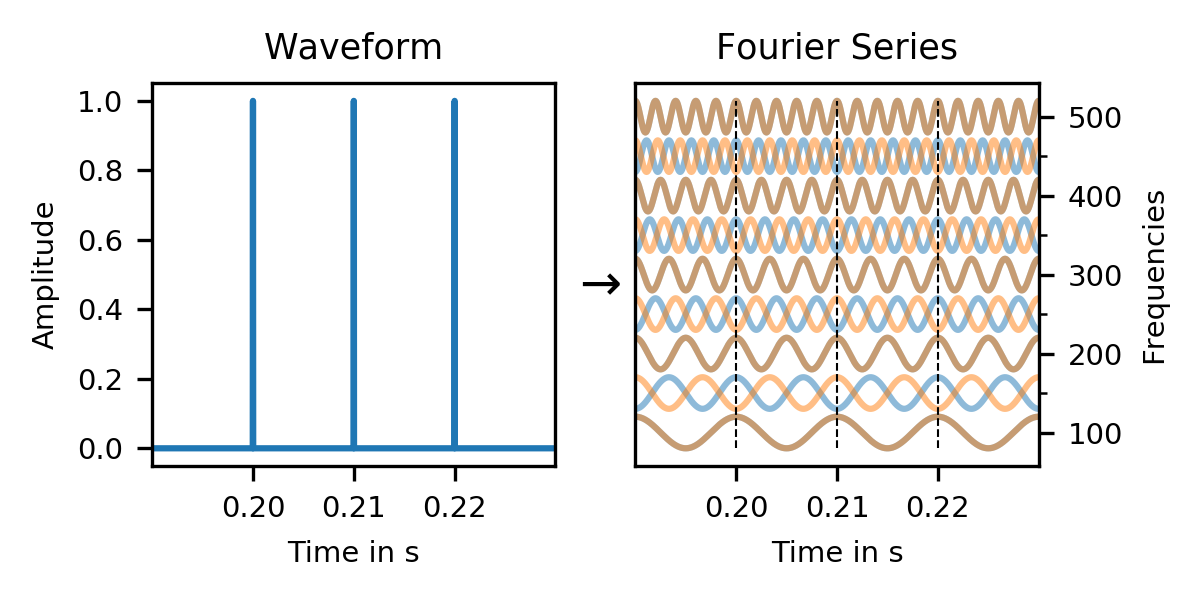
In a click train, odd frequencies in the Fourier series of the individual clicks cancel each other out (red/blue), and only harmonic frequencies (brown) remain. And this is exactly what our first spectrum showed: A periodic click train results in a harmonic spectrum.
Even though each click has a uniform spectrum, adding multiple clicks together cancels out all non-harmonic parts, and only a harmonic comb spectrum remains.
Analyzing Speech Signals in Time and Frequency
Our first stop in speech analysis is usually the short-time Fourier transform, or STFT1:
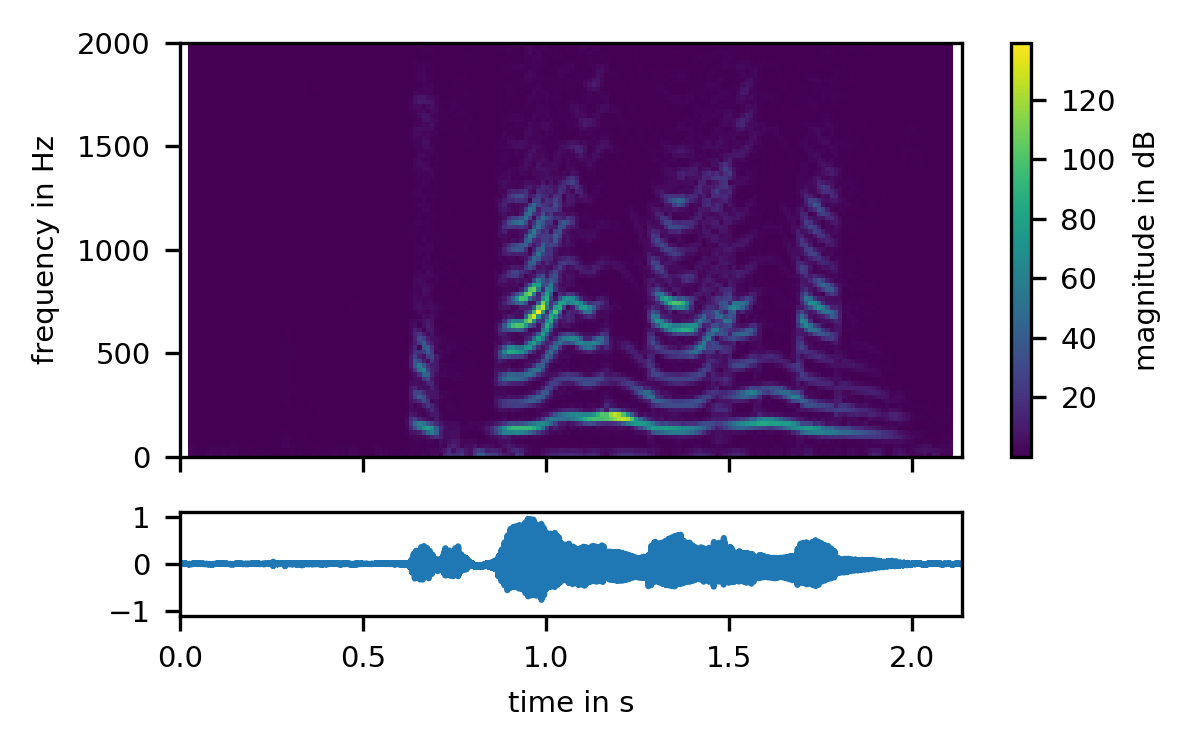
As we can see, this speech signal has a strong fundamental frequency track around 120 Hz, and harmonics at integer multiples of the fundamental frequency. We perceive the frequency of the fundamental as the speech's pitch. The magnitude of the harmonics varies over time, which we perceive as the sounds of different vowels.
All of this is clearly visible in this STFT. To calculate the STFT, we chop up the audio signal into short, overlapping blocks, apply a window function 2 to each of these blocks, and Fourier-transform each windowed block into the frequency domain:
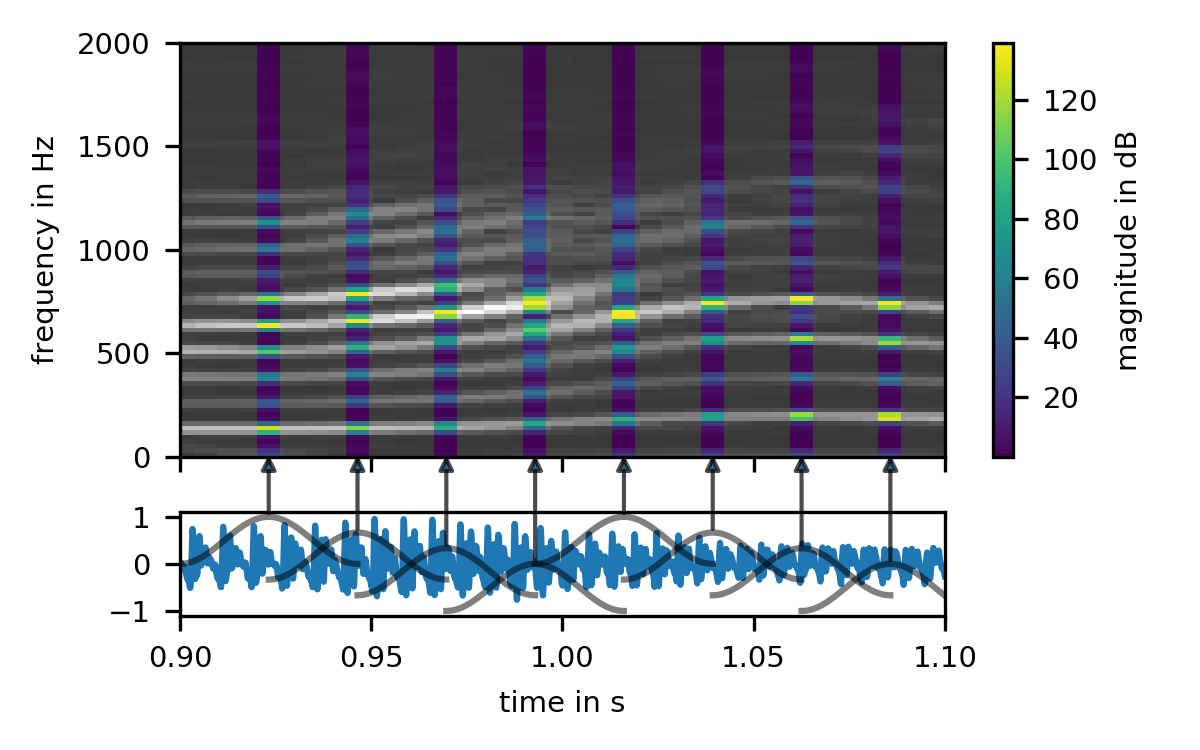
We zoomed in a bit to make this visible. At this zoom level, an old friend becomes visible in the waveform: The waveform of our harmonic spectra is clearly periodic. We also see that each of our blocks contain multiple periods of the speech signal. So what happens if we make our blocks shorter?
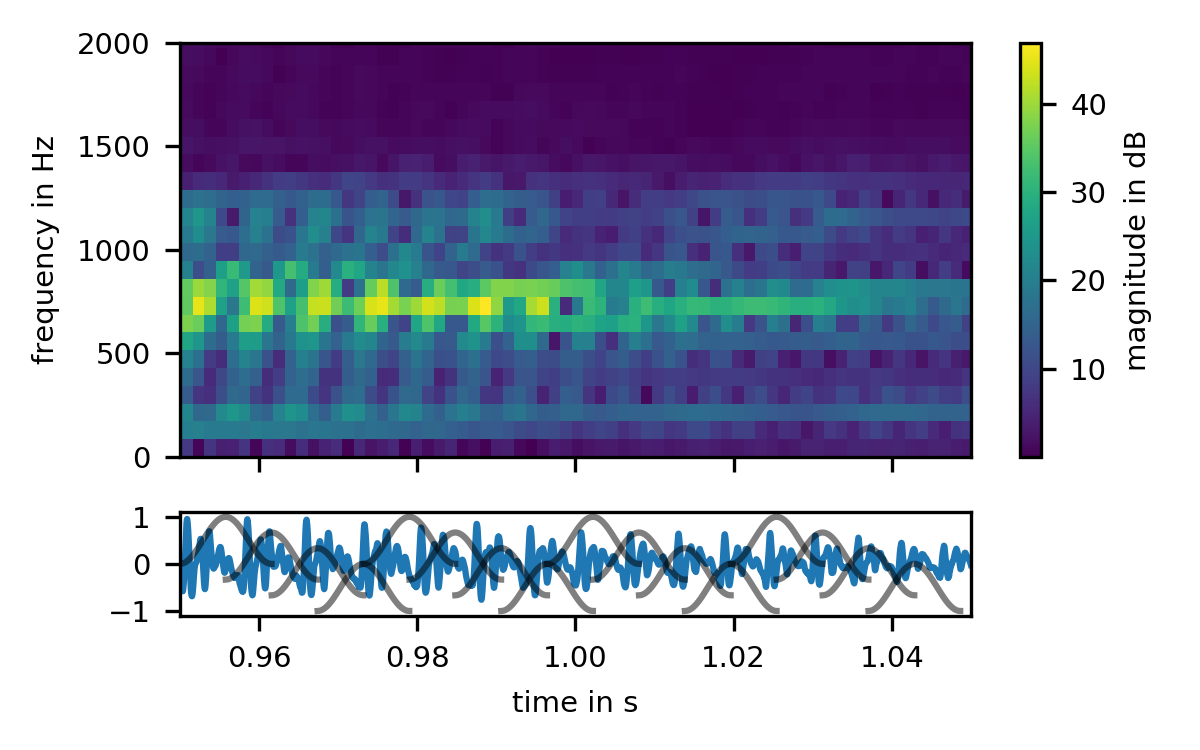
As we make our blocks shorter, such that they only contain a single period of the signal, a funny thing happens: the harmonic structure vanishes. Why? Because the harmonic structure is caused by the interference between neighboring clicks; As soon as each block is restricted to a single period, there is no interference any longer, and no harmonic structure.
But instead of a harmonic structure, we see the periodicity of the waveform emerge in the STFT! To look at this phenomenon in a bit more detail, we will have to leave the classical STFT domain, and look at a close sibling, the Constant Q Transform, or CQT. The CQT is simply an STFT with different block sizes for different frequencies:
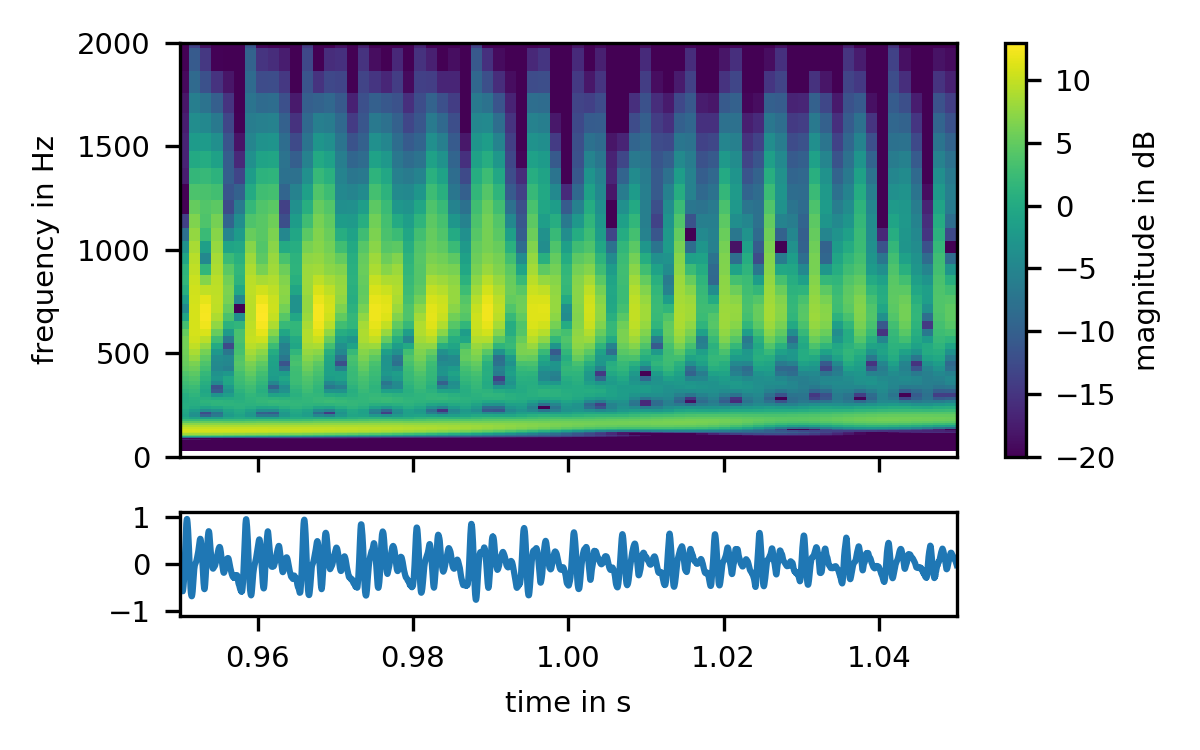
The periodic structure of the signal is now perfectly apparent. Each period of the signal gives rise to a skewed click-like spectrum that repeats at the fundamental frequency. Interestingly, however, the fundamental itself shows no periodicity. To see why this is so, and to finally get a grasp of how the short-time Fourier transforms interprets signals, we have to turn to our last graph, a gamma-tone filterbank:
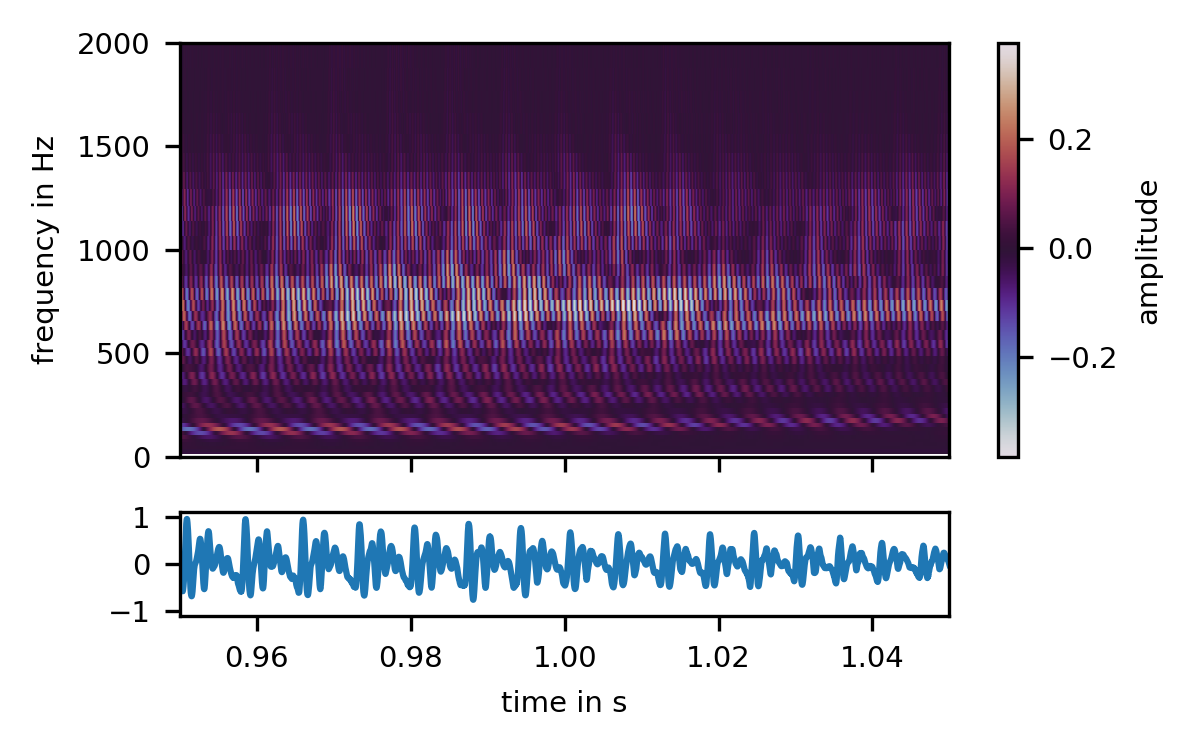
The fundamental frequency is now clearly a visible as a single sinusoid, rotating its merry way at 120 Hz. Each harmonic is its own sinusoid at an integer multiple of the fundamental frequency, but changing in amplitude in lockstep with the findamental. Thus in this graph, we see both the harmonicity and the periodicity at the same time, and can finally appreciate the complex interplay of magnitudes and phases that give rise to the beautiful and simple sound of the human voice3.
